
Dashboard Overview
Easily navigate your portfolio of properties with the user-friendly Property dashboard. Keep up-to-date with real-time analytics at all times.
Take a moment to review the essential details displayed on the centralized Property dashboard.
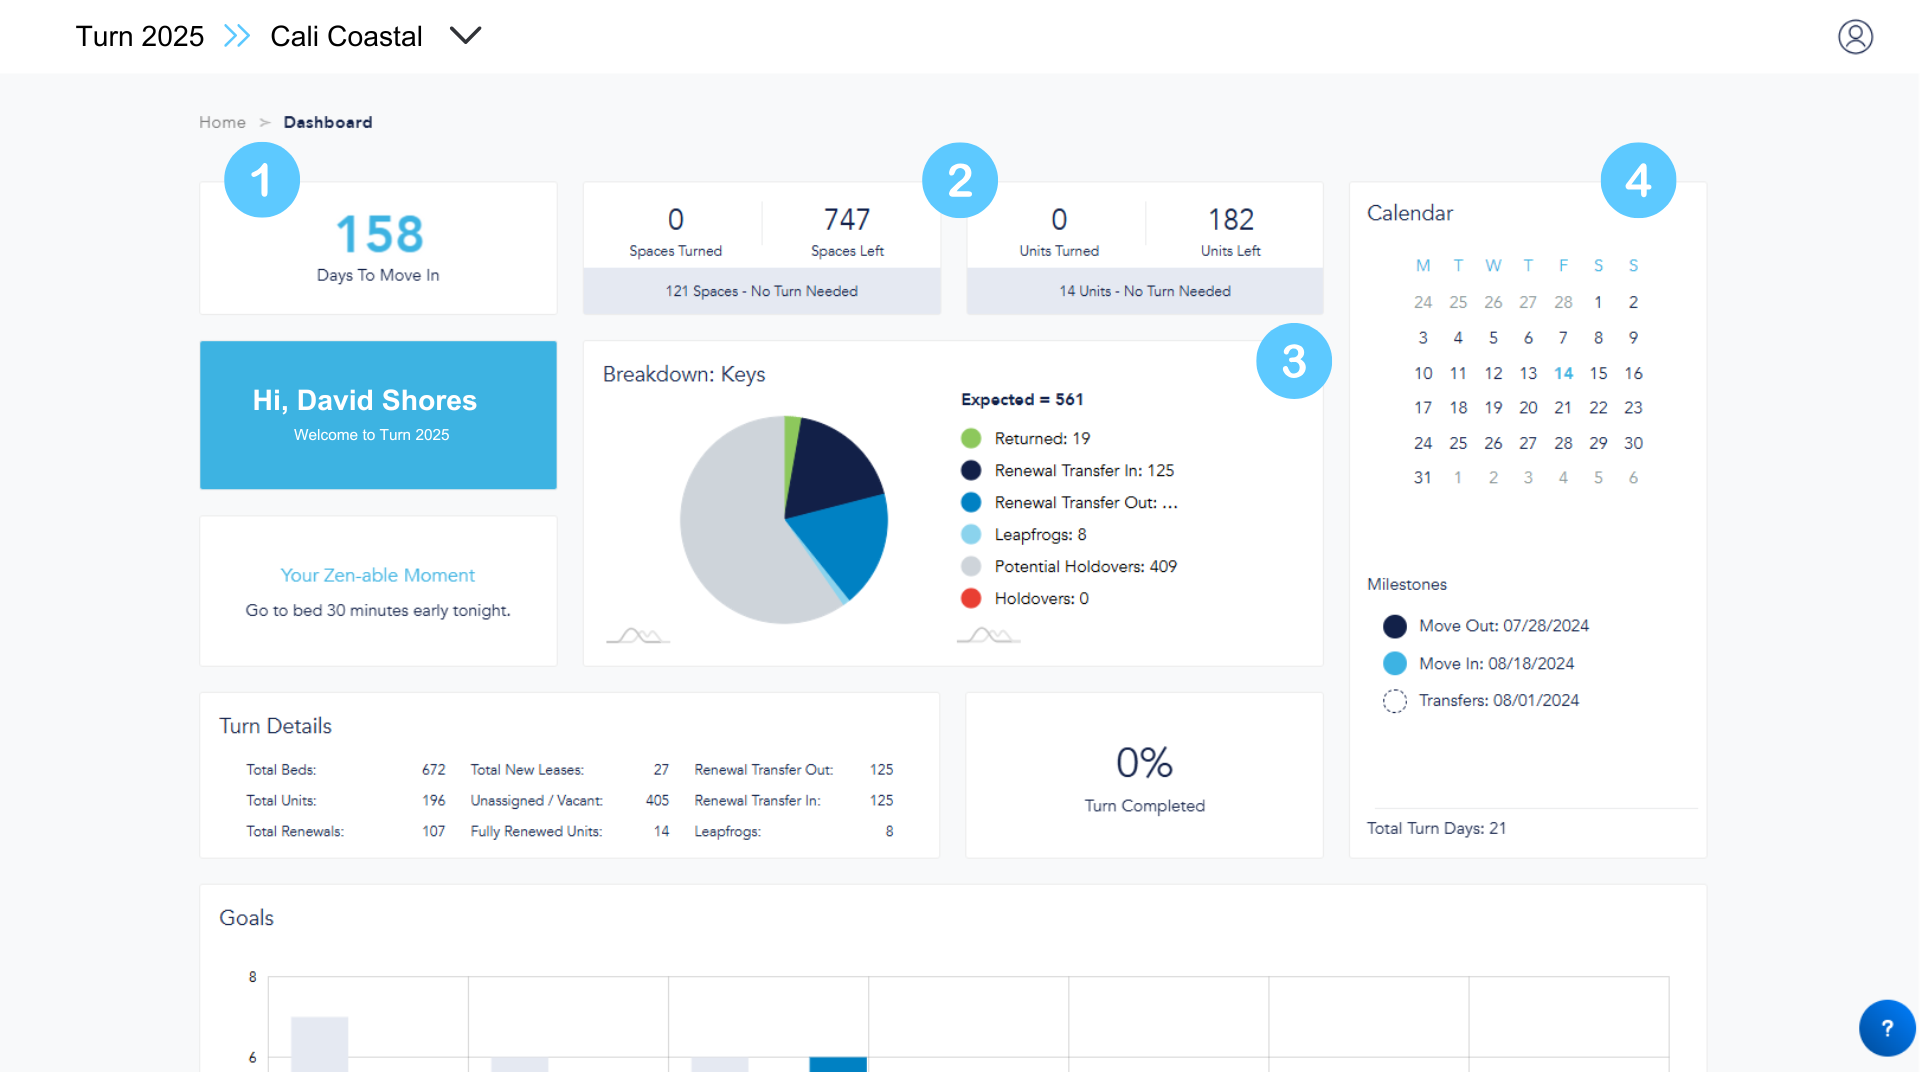
Top Row
- Days to Move In (based on move-in milestone date)
- Spaces Turned (these change when a unit/space is approved through Sparkle)
- Spaces - No Turn Needed (all renewed spaces, any common area (CA) that does not need work, as-is spaces, and any in-house space)
- Units - No Turn Needed (all fully occupied or full as-is units)
- Breakdown: Keys (reflects the number of residents expected to move out and the total numbers by lease status, as found on the keys tab.)
- Calendar (reflect pre-configured milestones established by customer leadership. Please see your internal project manager to discuss any changes and approved modifications can then be submitted to Support.)
Turn Details
These numbers are pulled directly from the lease management system. If there is an error, changes should be completed there.
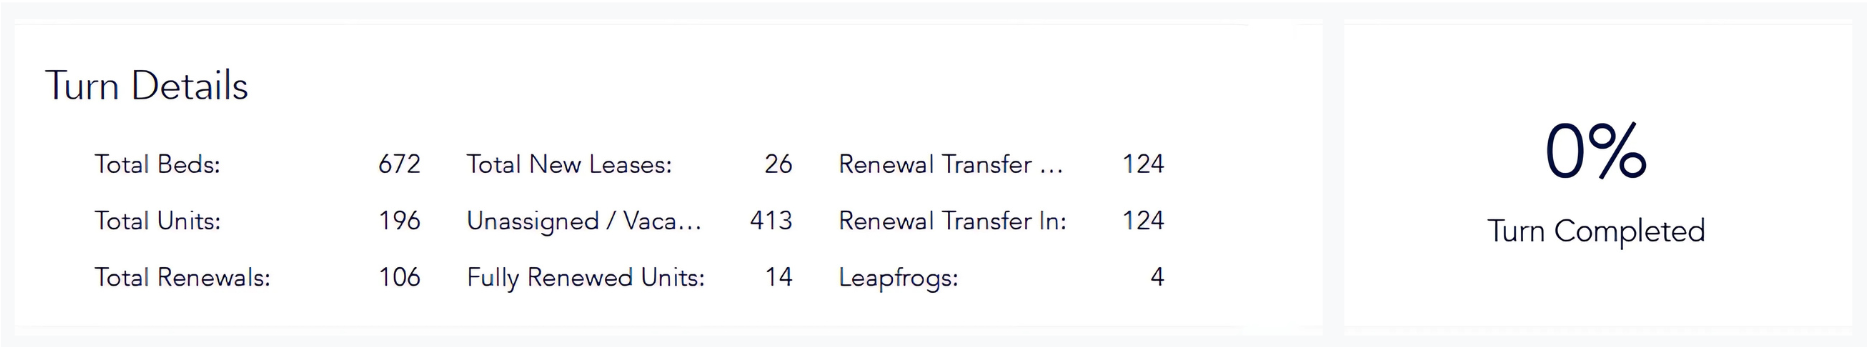
- Total Beds: Number of beds on property per lease management system. Shared spaces are treated as individual beds. [Total Beds = Total Renewals + Total New Leases + Vacant + RTI + Leapfrogs]
- Total Units: Number of units on property per lease management system.
- Total Renewals: Total number of current residents renewing their lease into the next lease term. This should match number of renewals listed on Keys tab.
- Total New Leases: Total number of spaces assigned to a new resident for the next lease term (does not include transfers).
- Unassigned/Vacant: Total number of spaces that are either unassigned or vacant for the next lease term.
- Fully Renewed Units: Number of units that are fully renewed for the next lease term.
- Leapfrog: When there is a TO and TI assigned to the same space. (It is considered best practice to filter the Keys tab by TI and TO to identify any UNITS that have both TOs and TIs assigned to spaces within the same UNIT.)
- Turn Completed: Percentage based off Spaces Turned (Approved through Sparkle) divided by the Total Number of Beds (No Turn Needed.)
Goals
Turnable developed the Goals bar graph for effortless tracking. Within this graph, each service is represented by columns showcasing both overall turn goals and daily turn goals.
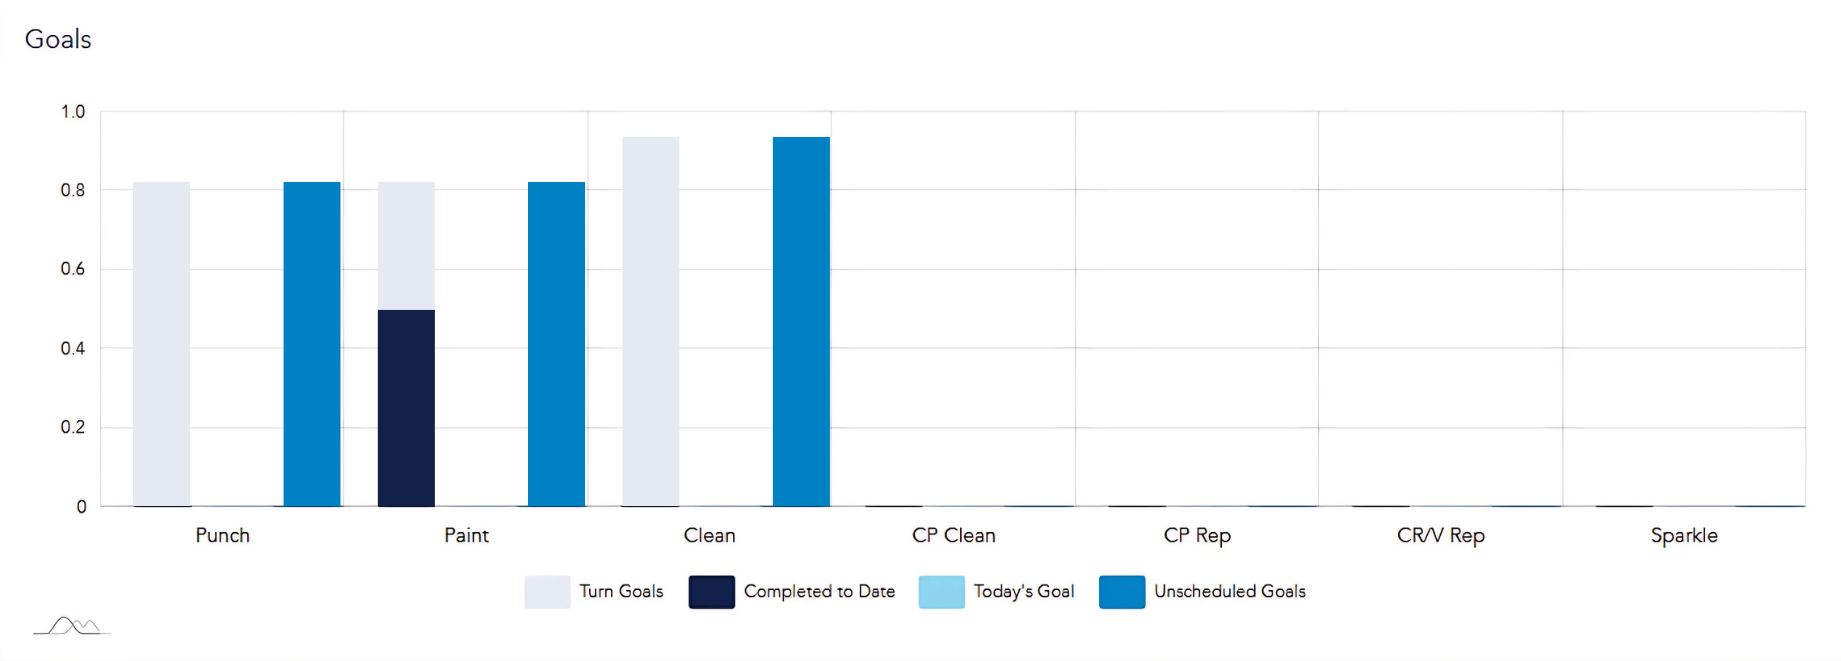
- Turn Goals: Number of spaces that require this service during turn.
- Completed to Date: For that service, number of spaces marked Approved.
- Today's Goal: How many spaces for that service should be completed by end of the day. *The goal number is determined based off of either:
Goal setup (total # of spaces that need that service/# of days you have a vendor on site doing that service.) For instance, if there are 100 spaces to paint, and the vendor will be on-site for 5 days; the turn goal would be 20 spaces per day. On the first day, the goal would be to complete 20 spaces. On the second day, the goal would increase to 40 spaces.
OR
Scheduled services using the Turnable Scheduling Tool available on the Turnboard.
- Goals (Detailed Option): If your site has selected to manage goals based on scheduled dates, then refer to this section.
- Today's Goal: Number of spaces that have a scheduled date on or before today's date
- Unscheduled Goal: Number of spaces that require this service that do not currently have a scheduled date assigned to them.
Service Completion Detail Ring
Metrics below rings are unit-based. Hovering over a ring will show what percentage of the units needing that service are in that status. Clicking the numbers in the metrics below the rings will advance to the respective service tab.
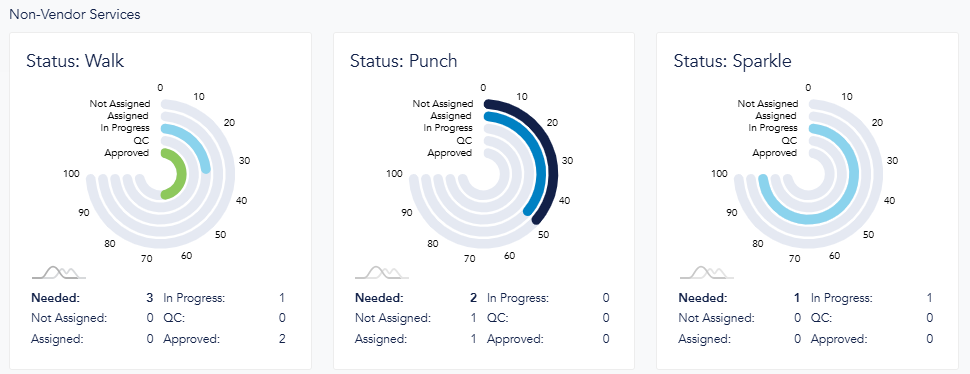
- Needed: Number of units that have one or more spaces that require this service.
- Not Assigned: Number of units not assigned to a team.
- Assigned: Number of units assigned but not started yet.
- In-Progress: Number of units that have been assigned and team is actively working on those units.
- QC: Number of units the team has completed the work for, but the quality check has not been completed.
- Approved: Number of units where the work has been approved.
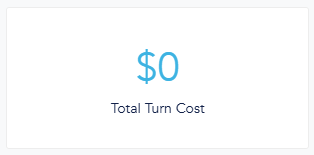
Total Turn Cost
The top number reflects the actual turn cost of the total budget, how much has actually been spent based on approved work and any additional charges.
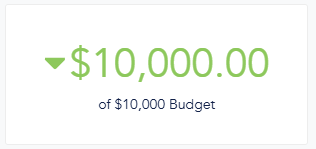
Budget Spend
The bottom number reflects the budget. The budget comes directly from the sum of the total service budgets entered during setup.
Costs by Service
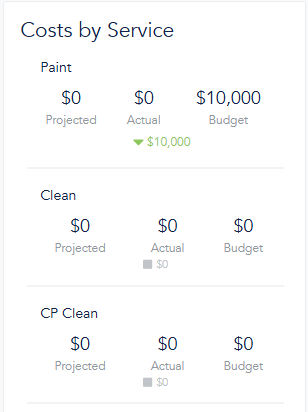
- Projected: The total expense for all required work associated with a service. If vendors are assigned to the work, Turnable uses the respective pricing workbook. In cases where no vendor is assigned to the work, Turnable calculates the cost based on the average price from all available vendors offering that service.
- Actual: The total amount spent for any work that is in the Approved status for that service, as well as any additional charges entered for the same service.
- Budget: Originates directly from service budgets entered during setup.